Understanding the J-Curve in Private Equity: Navigating the Investment Lifecycle

In the world of private equity, the J-Curve is a concept that describes the typical progression of an investment’s performance over time. It visually represents the initial period of underperformance, followed by a steep rise as the investment matures and generates returns. This phenomenon is an important aspect for investors to understand, as it helps explain the typical cash flow patterns and returns of private equity investments.
In this article, we’ll delve into the J-Curve concept, its significance in the private equity lifecycle, and how investors can navigate through the initial downtrend to achieve long-term gains.
What is the J-Curve?
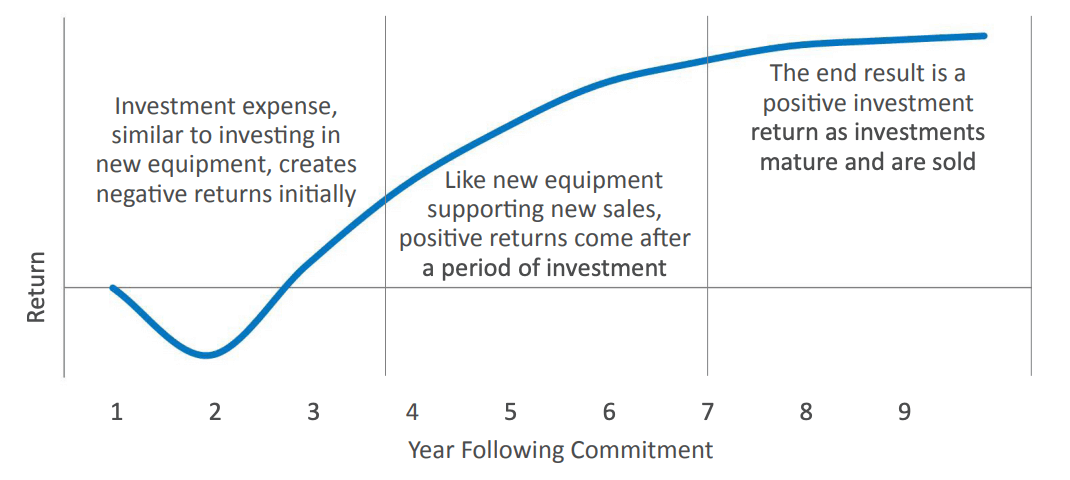
The J-Curve is a graphical representation of the performance of an investment fund over time. It is called a “J-Curve” because the graph typically starts with negative returns (the downward slope of the "J"), followed by a steep upward curve as the fund matures and begins to generate positive returns.
In the context of private equity, the J-Curve reflects the typical life cycle of an investment:
- Initial Phase (Negative Returns):
- During the early years of a private equity investment, the fund typically experiences negative cash flows. This is primarily due to the high upfront costs, such as management fees, transaction fees, and the capital deployment required for acquiring portfolio companies.
- Additionally, private equity funds generally have a longer investment horizon (5–10 years), which means that the companies in the fund’s portfolio have not yet reached their full growth potential.
- Maturation Phase (Positive Returns):
- As the fund progresses, the portfolio companies start to show improvement. Operational improvements, restructuring, or strategic changes begin to pay off, and the companies start generating higher revenue and profitability.
- Over time, these improvements lead to positive cash flows and increased valuation. The "upward curve" of the J-Curve occurs as these investments begin to realize returns, often through exits such as IPOs or sales to other firms.
- Exit Phase (Peak Returns):
- In the later stages of the fund’s life cycle, successful exits result in large cash inflows to the fund, generating substantial profits. These profits then lead to a steep rise in the performance graph, completing the J-shaped curve.
- By the time of exit, the private equity firm has typically created significant value in its portfolio companies, leading to high returns on invested capital.
Why Does the J-Curve Occur in Private Equity?
The J-Curve is a common phenomenon in private equity due to the following factors:
1. Initial Capital Deployment
When a private equity firm raises a fund, it begins by deploying capital into portfolio companies. In the early years, these investments may require significant capital expenditures, restructuring costs, and other expenses, which lead to a period of negative returns.
- Example: A private equity fund may invest in a company that needs significant operational improvements or product development before it can begin generating profits. This results in negative cash flows initially.
2. Management Fees and Expenses
Private equity funds typically charge management fees, often around 2% of committed capital per year, as well as transaction fees associated with acquiring and managing portfolio companies. These costs are incurred before any value is generated from the portfolio companies, contributing to negative early-stage performance.
3. Long Investment Horizon
Private equity funds typically have a long-term investment horizon, with a focus on generating returns over a period of 5–10 years. Early-stage investments, especially in more mature companies, can take time to realize value. This extended timeline means that negative returns are common in the early years, but as the portfolio matures, the investments generate more value.
4. Operational Improvements and Value Creation
In the middle stages of the fund, as portfolio companies undergo improvements, they begin to increase in value. This is the critical phase where the fund starts to experience positive returns, driven by strategic changes, revenue growth, and cost reductions that improve the performance of the underlying businesses.
5. Exit Strategies
The final stage of the J-Curve occurs when the fund begins to exit investments, typically through IPOs or sales to other companies or private equity firms. These exits can generate substantial cash returns for the fund, which significantly boosts its performance and leads to the steep rise seen in the latter part of the J-Curve.
How to Navigate the J-Curve as an Investor
For institutional investors or limited partners (LPs) investing in private equity, understanding the J-Curve is essential for managing expectations and making informed decisions. Here are some strategies for navigating the J-Curve:
1. Patience and Long-Term Commitment
Investors must be prepared for the initial period of underperformance and negative returns. It’s crucial to understand that the J-Curve is a natural part of the private equity lifecycle. Investors who commit to the fund for the long term are more likely to benefit from the eventual positive returns as the portfolio companies mature.
- Tip: Do not panic during the initial period of underperformance. Recognize that the eventual payoff requires time and patience.
2. Diversification Across Funds and Strategies
To mitigate the risks associated with the J-Curve, investors can diversify their portfolio by investing in multiple private equity funds with different investment strategies and timelines. This can reduce the impact of negative returns from any one fund, as some funds may reach the upward phase of the J-Curve more quickly than others.
- Tip: Diversify across sectors, fund strategies, and vintages to reduce risk and smooth out potential negative periods.
3. Monitoring Fund Progress
Although the J-Curve can be predictable, it’s important for investors to stay informed about the fund’s performance. Regular communication with the general partners (GPs) of the fund can provide insights into the progress of portfolio companies, the implementation of value-creation strategies, and potential exit opportunities.
- Tip: Stay engaged with the fund and monitor key performance indicators (KPIs) to ensure that the fund is on track to generate the expected returns.
4. Understanding the Impact of Fees
Investors should be aware of the impact of management fees, transaction fees, and carried interest on the fund’s overall returns. These fees are typically charged during the early years of the fund and can erode the returns in the J-Curve’s initial phase. Understanding these fees will help investors more accurately assess the fund’s performance.
- Tip: Factor in the cost of fees when evaluating potential returns, as these can have a significant impact during the early years.
Examples of the J-Curve in Action
Example 1: A Private Equity Fund Focused on Buyouts
Consider a private equity fund focused on leveraged buyouts (LBOs). In the early years, the fund may face negative returns as it acquires portfolio companies, restructures operations, and incurs high costs related to improving efficiency and profitability. However, after 3-5 years, the portfolio companies begin to perform better, resulting in positive cash flows. Eventually, the fund begins to exit its investments through sales or IPOs, leading to a significant increase in value and a strong upward curve in the performance graph.
Example 2: A Private Equity Fund Focused on Venture Capital
For a private equity fund focused on venture capital (VC) investments, the J-Curve can be steeper, as many early-stage companies require significant investment and time to reach maturity. In the initial years, there may be few exits and many investments are still in the development or scaling phase. Once a few companies reach successful exits, such as through an IPO or acquisition, the fund's performance rises sharply, generating significant returns for investors.
Conclusion
The J-Curve is a natural part of the private equity investment lifecycle. While the early years of a private equity fund may bring negative returns due to capital deployment, management fees, and the time required for portfolio companies to mature, the eventual payoff can be substantial. As the portfolio companies grow and exit, the fund’s performance typically experiences a sharp upward trajectory, resulting in high returns for investors.
For institutional investors, understanding the J-Curve is essential for managing expectations and navigating the private equity investment process. Patience, diversification, and active monitoring of the fund’s progress can help investors successfully navigate the J-Curve and maximize their long-term returns.
FAQs
1. Why does the J-Curve occur in private equity?
The J-Curve occurs because, in the early years, private equity funds typically incur costs for acquisitions, management fees, and restructuring, while portfolio companies are still in their growth phase. Over time, as companies mature and generate returns, the fund's performance improves, resulting in a sharp upward curve.
2. How long does the J-Curve last?
The duration of the J-Curve can vary depending on the investment strategy and the performance of portfolio companies. Typically, the negative phase can last 2-3 years, with the upward curve starting after this initial period and continuing for the remaining life of the fund (usually 5-10 years).
3. How can investors manage the J-Curve?
Investors can manage the J-Curve by being patient, diversifying their portfolio, and staying engaged with the fund. Regular monitoring and understanding the fee structure can also help mitigate the impact of early-stage underperformance.
4. Does every private equity fund experience a J-Curve?
While most private equity funds experience some form of J-Curve, the depth and duration of the negative phase can vary depending on the fund’s strategy, the market environment, and the types of companies in the portfolio.
5. How can understanding the J-Curve help investors?
Understanding the J-Curve helps investors set realistic expectations about the timing of returns and the investment cycle. It also allows investors to assess whether a fund is on track to meet its return objectives based on the typical patterns of private equity performance.